Supercharge your Thunderbird extension debugging
Debug a Thunderbird mail extension right from Visual Studio Code
As you might know I'm the author of mailmindr, the extension for adding a follow-up functionality to MZLA Thunderbird. It all started with Thunderbird 2 (yes, "two"), when I was first using Thunderbird: an email client, extensible by small chunks of code of JavaScript. As JavaScript is one of my habits, I was attached and created my first extension, mailmidr.
Thunderbird's extension system got a complete overhaul in the last years and became similar to "web extension", the extension format which is supported by Mozilla Firefox, Google Chrome and Microsoft Edge. This enables developers to write extensions, or "mail extensions" as they are called in Thunderbird, in a more lightweight fashion than it were from the beginning of Thunderbird until its version 78.
For most extension developers who already had written an extension based on the old structure with XUL, jsm and XPCOM this shift is a hard take, as it requires a refactoring close to completely rewriting the extension. Along with the refactoring comes a workflow change on how to debug an extension:
- Start Thunderbird
- Open the "Debug Add-Ons" tab via the main menu
- "Load temporary Add-on" and select your extensions
manifest.jsonfile - Wait for the add-on to load and debug it
- Switch to your IDE and make changes in the code files
- Switch back to Thunderbird
- Click "reload" in the "Debug Add-Ons" tab
- Proceed with 4. or maybe open Thunderbird's debugger to hunt down a bug by setting breakpoints
If you're in the need for testing your extension on multiple versions of Thunderbird, this process becomes quite a hassle:
- Once Thunderbird is closed and re-opened, you have to repeat the process to (temporary) load the extension
- breakpoints may be lost
- You have to locate the correct Thunderbird version and to load it with different profiles, either by profile manager or command line
Prerequisites for supercharging your debugging
Thunderbird itself
To develop a Thunderbird mail extension it's a good idea to have Thunderbird itself installed. You can download it right at Thunderbird's official website. Go ahead, install it and create a local Thunderbird user profile with a working mail account. If you're already a Thunderbird user, I highly recommend to create a separate user profile for development purpose as it is not unlikely to end up with a non-working profile. No worries, Thunderbird isn't prone to errors, but your code might be.
A mail extension
If you want to follow the instructions in this article while reading, I recommend having a working mail extension at hand. No worries if you haven't, there's the Thunderbird sample extensions repository available on GitHub with many examples for quite a bunch of building blocks for your own idea. Each subdirectory within this repository contains a separate extension with its own manifest.json file.
So when using this as a starting point, make sure to navigate to a subfolder, so that manifest.json is located in your working directory, as the following example for the subfolder messageDisplayScript:
├── README.md
├── manifest.json
└── src
    ├── background.js
    ├── message-content-script.js
    └── message-content-styles.css
The manifest.json file is the root of your mail extension. This mustn't be the root of your repository, it can also be deep somewhere in your repositories subfolders. Be aware that the position of the manifest.json file in your folder tree is the entrypoint of your extension, so when you're just use simple bundling by zipping the extensions contents, everything below the folder level of manifest.json will be included in your extension.
The right IDE for the job
For most of my development work I'm using Microsoft Visual Studio Code (or "VS Code" in short), so this is my editor of choice for writing mail extensions. If you haven't worked with VS Code before, it is worth a look as it has a built-in git client, a debugger, a smart autocompletion and syntax highlighting for many languages out of the box as well. You can download it free of charge at the official VS Code website or use the package manager of your operating system if VS Code is available via this installation method.
One huge benefit of VS Code is the capability to extend it with different extensions, so you start off with an almost powerful editor and then add as more superpowers as you like and need it.
In general, I don't recommend an IDE, as you might know better what is the best fit for you. For this job I recommend to use VS Code, as I haven't found any similar extension/plugin/add-on for the other IDEs I'm addicted to and which are also great tools (namely Sublime Text and Jetbrains WebStorm).
Once you have installed VS Code and have started it you should check out the "extension marketplace", as Microsoft calls the extension library.
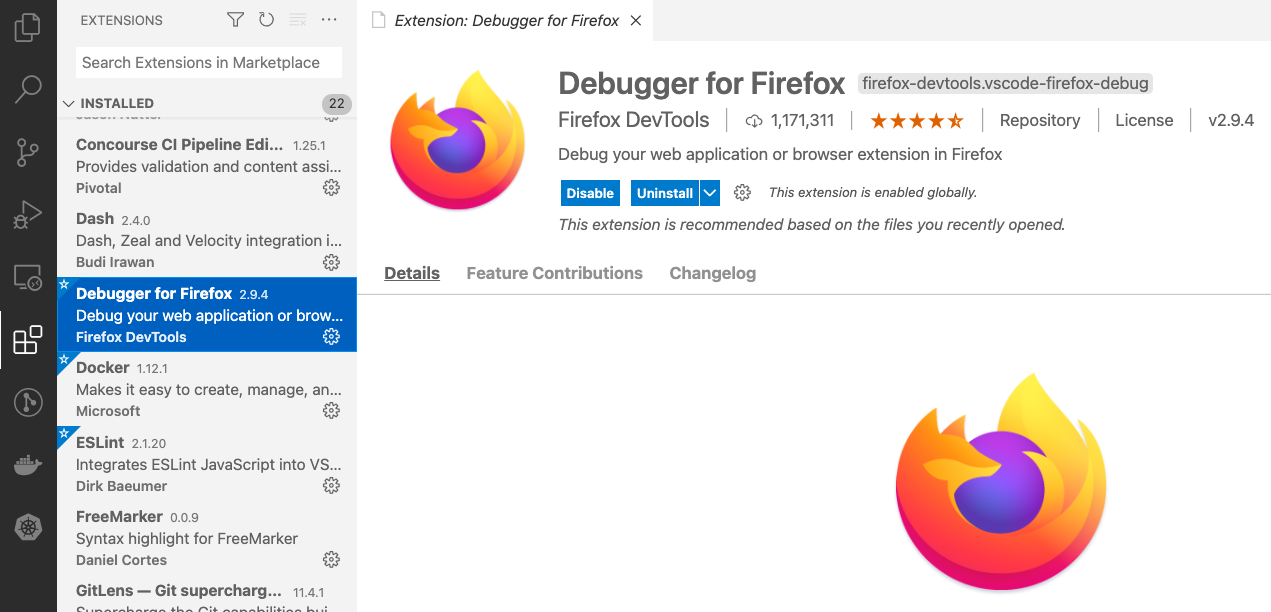
Open the extension marketplace and search for the extension we're going to install and which is a key component for debugging our mail extension: "Debugger for Firefox" (Extension ID is firefox-devtools.vscode-firefox-debug). Wait, Firefox? That doesn't seem correct, but as I already said, the extension structure is close to the web extension structure, so trust me, this will work.
Unleash the debugger
Now you should have VS Code along with the extension "Debugger for Firefox" installed, so it's time to ensure if you're able to debug the extension itself. A good starting point is a working extension, so you can test if your debugging system is set up correctly. If you're able to temporary load the extension and to open Thunderbird's built in debugger, you're ready for configuring Visual Studio Code.
Prepare Visual Studio Code
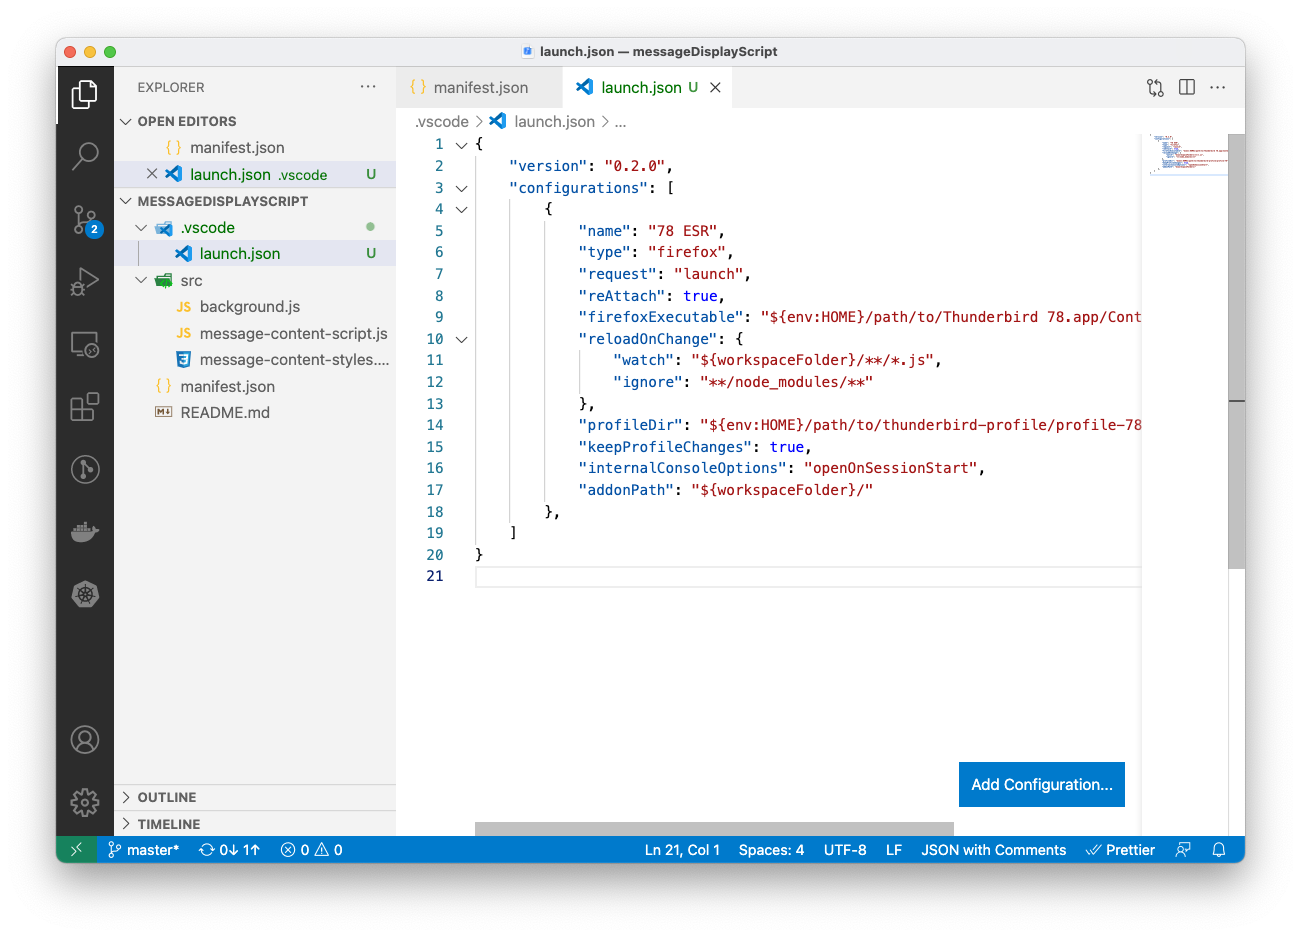
Start Visual Studio Code and open the folder where your projects manifest.json is located. Now create a folder called .vscode (mindr the prepending .) and create a JSON file named launch.json within this folder. Copy and paste the following JSON as content to the launch.json file:
{
    "version": "0.2.0",
    "configurations": [
        {
            "name": "78 ESR",
            "type": "firefox",
            "request": "launch",
            "reAttach": true,
            "firefoxExecutable": "${env:HOME}/path/to/Thunderbird 78.app/Contents/MacOS/thunderbird-bin",
            "reloadOnChange": {
                "watch": "${workspaceFolder}/**/*.js",
                "ignore": "**/node_modules/**"
            },
            "profileDir": "${env:HOME}/path/to/thunderbird-profile/profile-78",
            "keepProfileChanges": true,
            "internalConsoleOptions": "openOnSessionStart",
            "addonPath": "${workspaceFolder}/"
        },
    ]
}
Your editor should now look similar to this screenshot.
Adjust the settings
Before we can lift off with debugging, you need to adjust the settings. I'll explain them as good as I can, but if there are any uncertainty, please drop me a DM via @arndissler on Twitter or reach out by email.
name- The name of your debugging configuration. Pretty handy when you're debugging on multiple Thunderbirds, so you can name the configurations like 78 ESR, 86 beta, etc.
type- Type of he configuration profile, so keep
"firefox". request- Possible values are
"launch"and"attach". Since you need to start Thunderbird via the command line in debug mode, we're passing this task over to Visual Studio Code and set"launch". reAttach- When set to
true, Thunderbird will not be terminated when you stop the debugging session and it remains open, waiting for you to start a new debugging session. Otherwise, e.g. when set tofalse, Thunderbird will shut down when you end the debugging session. firefoxExecutable- That's the full and absolute path to the executable file for your Thunderbird. For macOS this is not the Thunderbird.app file, so you must point to the executable file called
thunderbird-binwithin theContents/MacOSfolder of the application file. For Windows users this is the absolute path of theThunderbird.exe. reloadOnChange- Reload your extension whenever a source file has changed? Here's your setting. Given an object with the keys
watchand the optional keyignoreyou're able to let Thunderbird reload your extension. If you're just looking for one pattern (like in my example), you can just pass strings with a glob pattern, but an array as value is also okay so that[ "${workspaceFolder}/**/*.xul", "${workspaceFolder}/**/*.js" ]is a valid pattern for watching XUL and JavaScript files. profileDir- Give an absolute path to a valid Thunderbird user profile matching the version of your
firefoxEceutable. If you're starting a Thunderbird 78 ESR release, then your corresponding profile should be a valid Thunderbird 78 profile. Be warned that if the versions doesn't match, this can lead into a corrupt profile and all the profiule data might be lost. keepProfileChanges- All your changes will be persisted, even when you end the debugging session. This is quite handy when you're debugging an extension for longer, but it's the absolute worse thing to do when you want to test your update mechanism, e.g. when you're using a database and want to test your code to write the database contents to a local storage.
internalConsoleOptions- Vidual Studio Code has a built-in debugging console. If you want to open this on startup of the debugging session feel free to do so.
addonPath- That's the path where your
manifest.jsonlives in.
That's just a brief overview of a possible configuration. If you're interested in what's down in the rabbit hole visit the List of possible configuration settings for VS Code Debugger for Firefox and the list of valid launch.json attributes.
On each development system the pathes might vary, and so do they for different operating systems. I'm using macOS, but if you're on Windows, your pathes are completely different. If you're a solo developer it's good to have all the pathes matching your own needs, but when you're working with others it's a good advice to have a running configuration which matches the needs for all team members. As I'm the only one working on my extension, I'm using a configuration suitable for macOS, but I'm switching work machines every now and then, so I strongly recommend to not have hardcoded pathes for your debug configuration. Visual Studio Code has good solutions for platform specific properties (Windows, Linux and macOS) as well as variable substitution to not have hardcoded pathes, neither relative nor absolute, in your configuration.
Already said, I'm switching my work machines even during the day, so my environment and username is subject to change, but having all pathes relative to my extension's root folder and my user's home folder helps me to be able to run a debug session on all my development machines. If you look at the configuration closely, there's a ${env:HOME} placeholder which is replaced with the contents of the environment variable $HOME of my local system. The same applies to ${workspaceFolder}, which points to the root folder you have loaded in Visual Studio Code, and that's why I have recommended to open the IDE with manifest.json on top level. If you haven't followed this, you need to adjust the path accordingly.
But long story short: if you have modified the configuration to match your development system and your needs, you're ready to go.
Let's roll
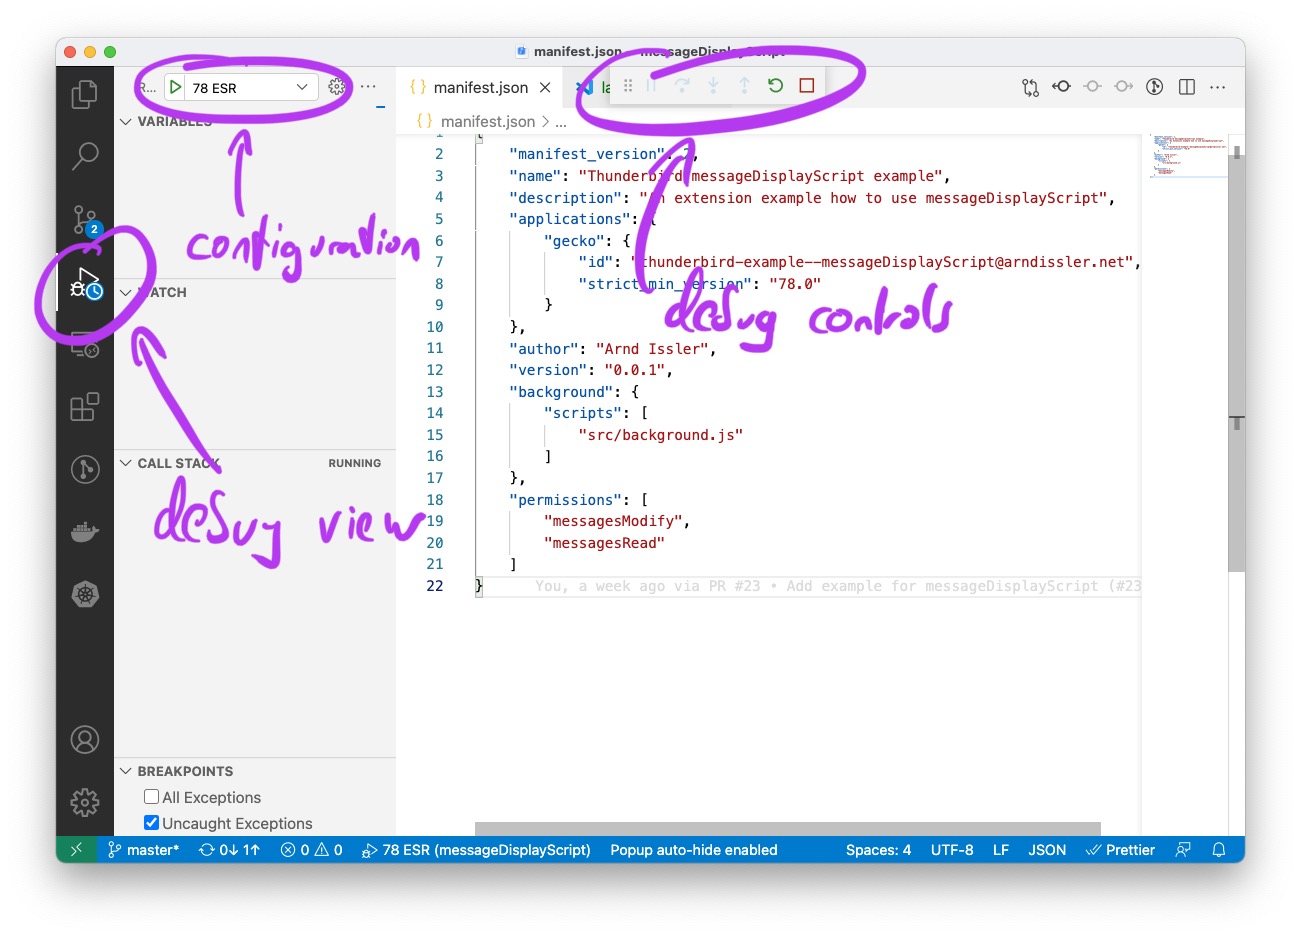
Open the debuggig view (or "Run View" in Visual Studio Code terminology) and select the debug configuration you just set up. To switch to the debug view, check for the "play" button with the little bug on the left side. Now ensure that the select box in the top area of the sidebar contains the configuration you want to start up.
If you now press the green "play" button to the select box' left, the configuration will be started and after a couple of seconds a Thunderbird window should appear. Meanwhile the debug controls in Visual Studio Code will appear. If they are disabled you should make Thunderbird the currently active application and wait some seconds. Once the Thunderbird debugger is ready, the controls will be as well.
Basically, that's it. You can now set breakpoints in the code editor by clicking in the area left to the line numbers. A dimmed red dot will appear when no breakpoint is set. If you set the breakpoint and it is accepted by the debugger, the red dot will stay permanent and appear as red dot without dimming. The breakpoint is then "active".
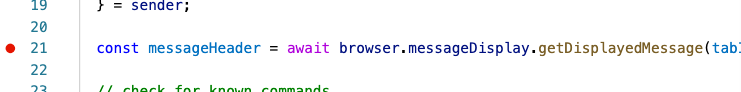
If the debugger hits such an active breakpoint it will stop at this breakpoint and the line will be highlighted in a post-it yellow style.
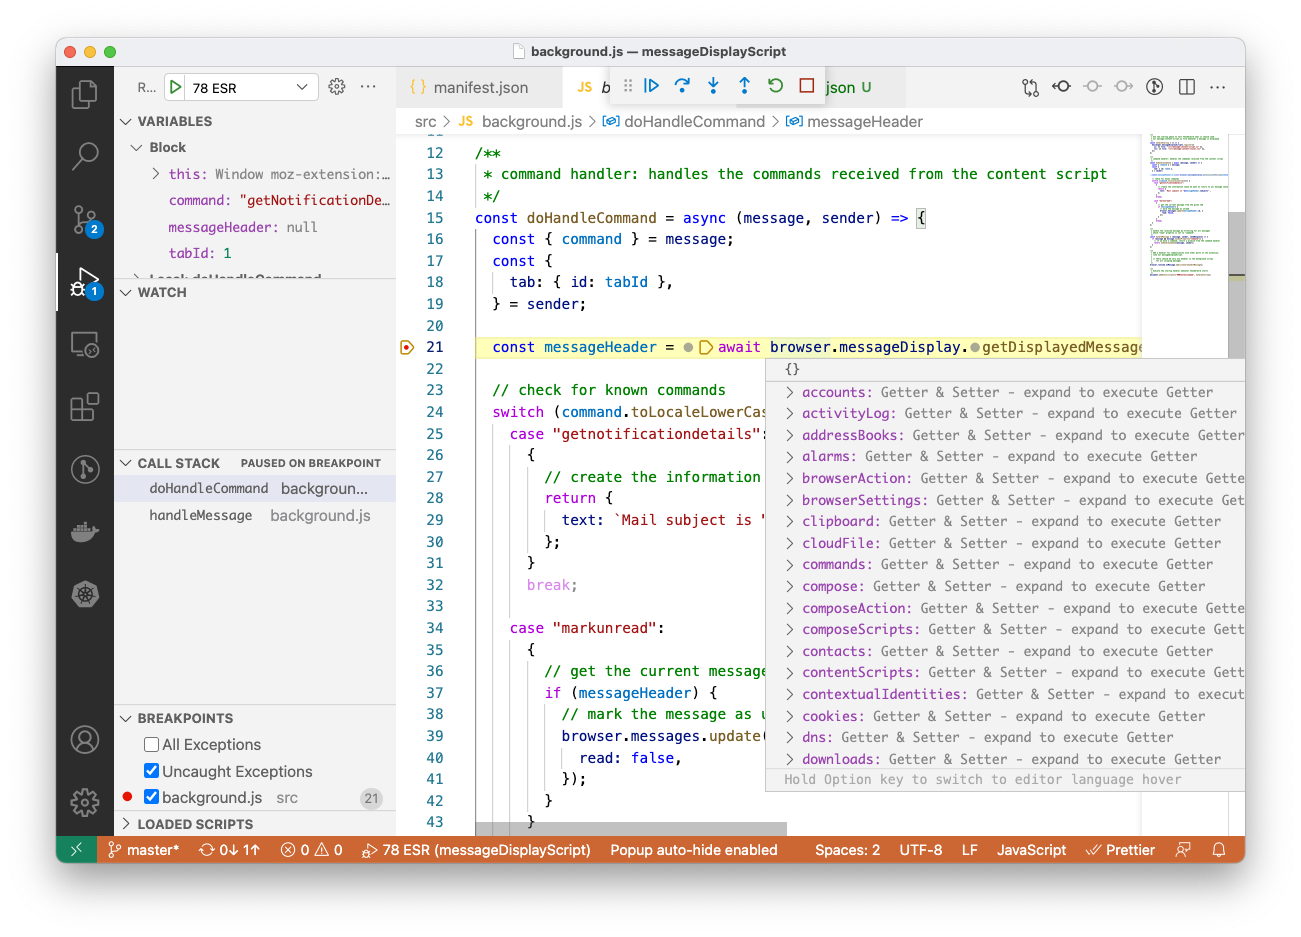
All currently available variables and their values appear in the left sidebar section VARIABLES. In the WATCH section you can add variables you're looking for more often and in the CALLSTACK section you can check if your script was called in the correct order. One of the huge benefits is Visual Studio Code's "mouse over", so you're able to hover over, say, browser. (line 21 in the screenshot, right after await) and a popup with the contents of the browser variable appears, in our case this is the exposed API, so we're getting the list of all implemented APIs: accounts, activityLog, addressBooks, etc.
Troubleshooting
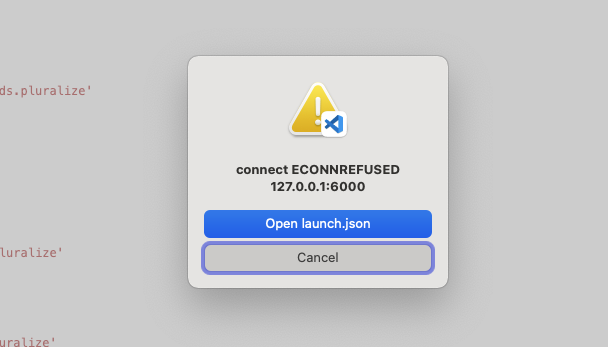
connection ECONNREFUSED 127.0.0.1
Every now and then there's a dialog with the error message connection ECONNREFUSED 127.0.0.1:6000, along with an OK and Cancel button. Just cancel the dialog and try again, no need to worry. The debugger got a hiccup and couldn't establish the connection. Try again once the dialog has closed and Visual Studio Code returns to normal mode from debugger mode.
If the ECONNREFUSED error occurs even after some more restarts, you should try to set an increased timeout value for the debugger to wait for Thunderbird to start. As of writing this article the default timeout is set to 5 seconds, so I suggest to start with 60 seonds and decrease the value in steps of 5 seconds until it's not working anymore and then step back to the last setting.
{
    …
    "addonPath": "${workspaceFolder}/",
    "timeout": 60
    …
}
Dead Objects
When you're using the debugging console in Visual Studio Code and experience a lot of can't access dead object warnings and errors from Thunderbird: it's not caused by the attached debugger and also likely not by your extension. It seems like there are some things going on under the hood of Thunderbird itself, so fingers crossed that this will be solved soon. There's nothing you can do here.
Thunderbird won't start on Windows
I experienced some rare situations on Windows where Thunderbird refuses to start properly. This can be caused by multiple issues. If your debugging console output tells you that the debugger wasn't able to connect to something like server1.conn0.…, you might need to increase the debugging timeout (see above). If Visual Studio Code is still not able to stat Thunderbird when you start the debugging session (hitting the green "play" symbol or by pressing F5 key), you can check if the debugger can connect to Thunderbird at all. To test this, switch the property request of the said configuration in your launch.json from launch to attach.
After you changed the setting to tell the debugger to attach to a running Thunderbird instance, you should start up Thunderbird from the command line:
C:\>"C:\Program Files\Mozilla Thunderbird\thunderbird.exe" --profile c:\path\to\a\thunderbird\profile --start-debugger-server
The --profile <path> parameter gives Thunderbird the path to your profile folder, so that you can start it with your testing profile without opening the profile manager. The --start-debugger-server will tell Thunderbird to wait for incoming debugging connections, so head over to Visual Studio Code once Thunderbird has started. When you run the debugging configuration, the debugger will check for a running Thunderbird and tries to connect to the debugger.
This might be your way to work with the debugger on slow computers.
If this works for you, you can also add the parameter to the debug configuration by adding the firefoxArgs property - and don't forget to switch back to "request": "launch":
{
    …
    "timeout": 60,
    "request": "launch",
    "firefoxArgs": ["--start-debugger-server"],
    …
}
Conclusion
Setting up an external debugger for Thunderbird is quite painful, but the result will be a pretty neat feature when you're working in extension development.
If you find this article helpful, please share it and feel free to head over to the mailmindr's donation page. And if you have questions, please drop me line.
Read my next post: Bluesky invite codes